

visualising tool
To visualise in your browser the Equi7Grid, we've set up a dynamic and interactive web viewer.
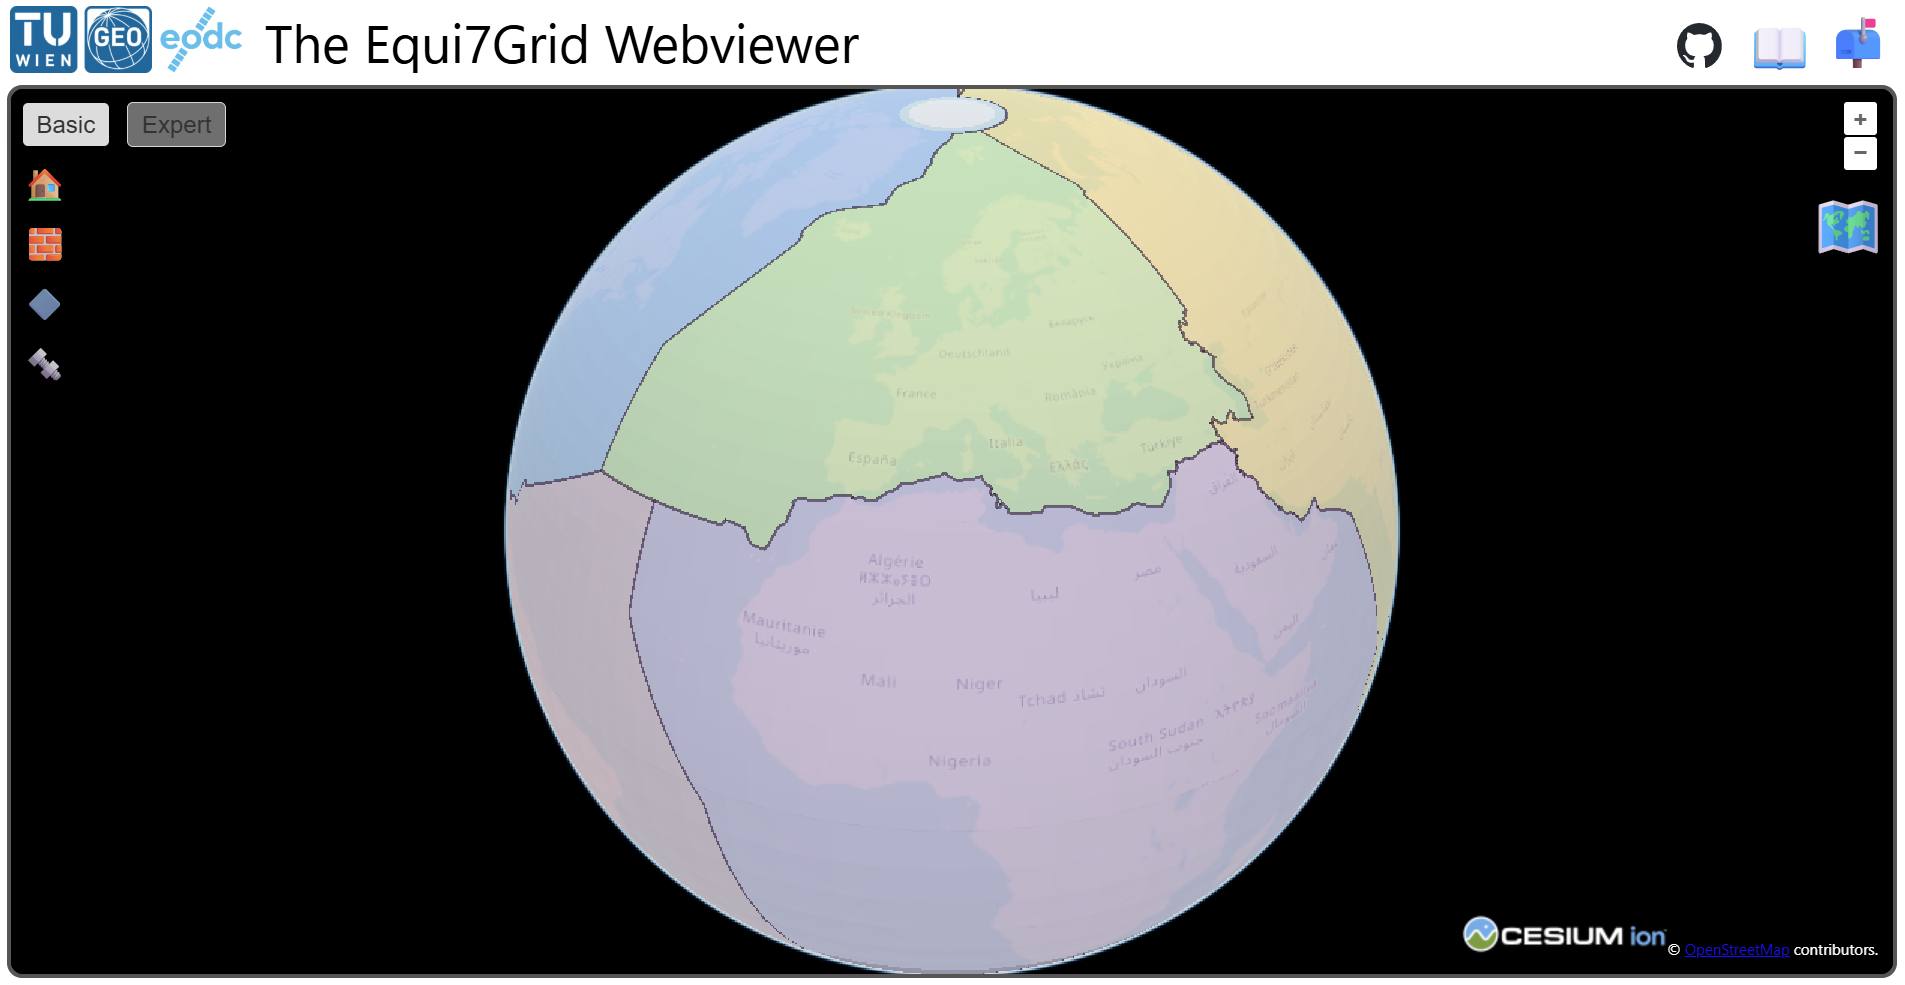
It is also a tool to display and interact with the projection zones, coordinates, and tiling options of the Equi7Grid system. The webviewer can help as a high-level interface for users, who want to get a visual understanding of the grid system without touching any code.
expert tool
But the tool is also very helpful for advanced users, e.g., to fetch tile lists, export geotransformation parameters for further data processing, and explore new user-defined tiling schemes.
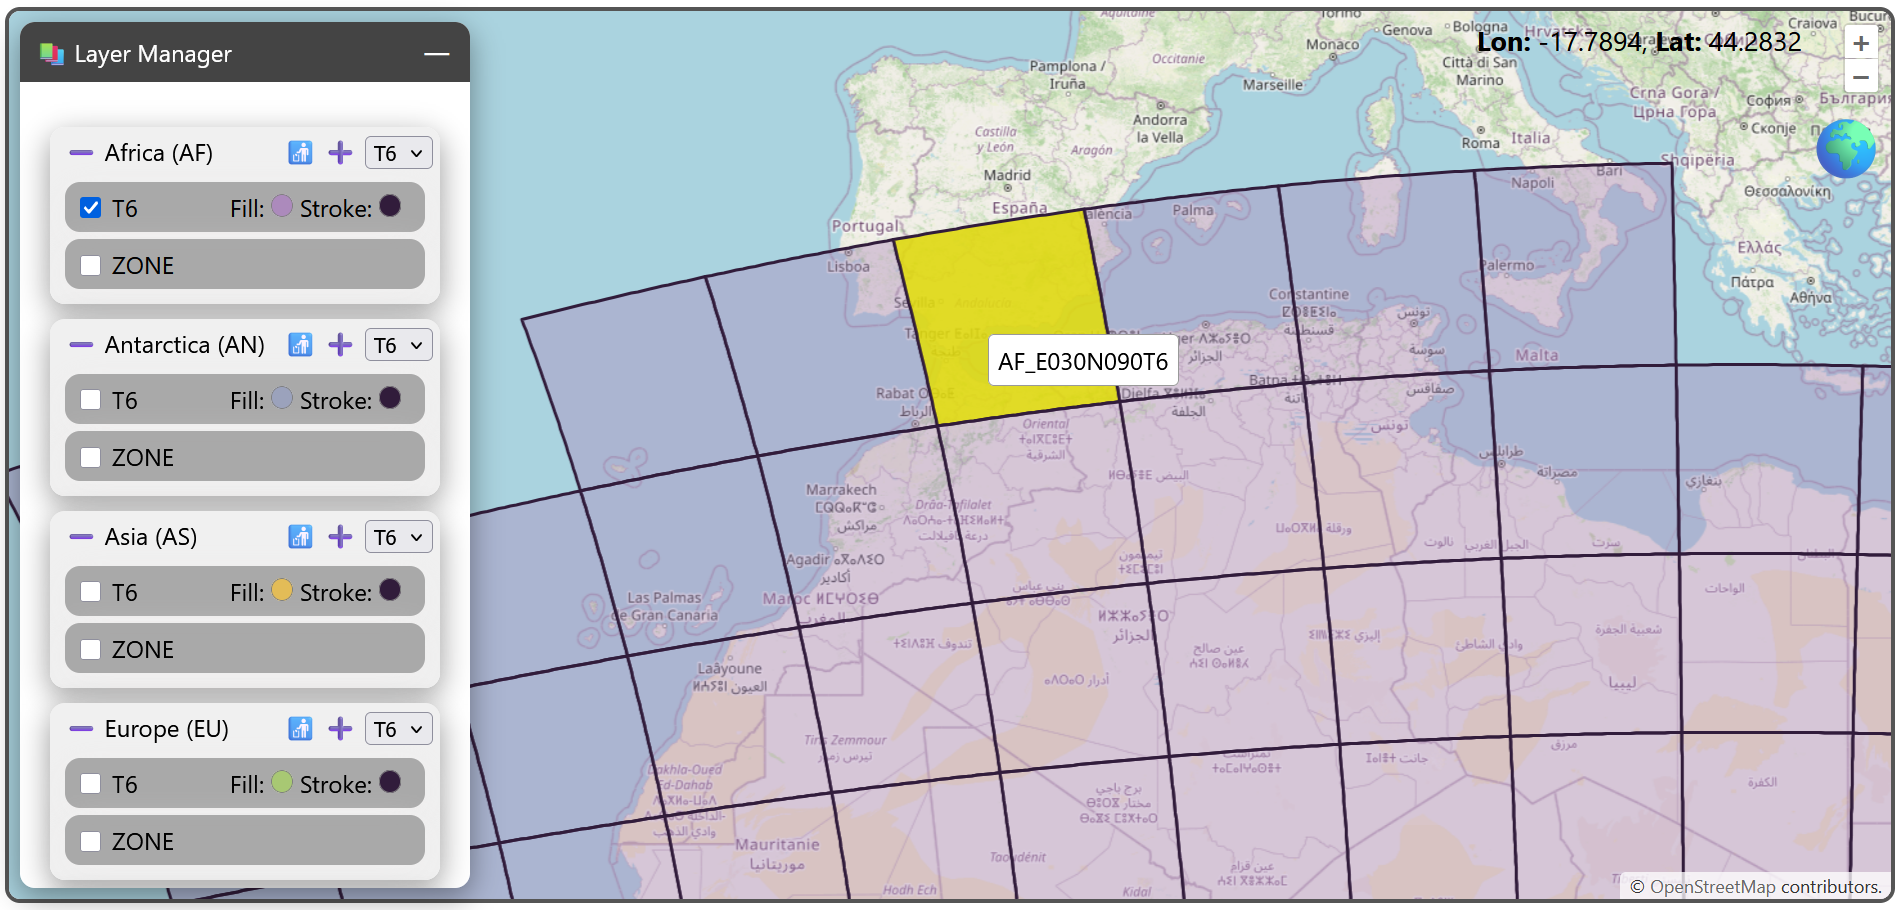
The webviewer offers an expert mode, which is for users who do not only want to display predefined zones and tiles, but rather want to exploit and use advanced features of the Equi7Grid. Here, users can explore and export new setups on resolution levels and tiling schemes that fit dedicated purposes, while keeping compatibility with the Equi7Grid framework.